From a table to your first function.
On a vending machine, pressing A3 drops the same bottle every time, and pressing B1 drops the same packet of biscuits. The same button gives the same result; a different button gives a different one. Buying water works the same way: one bottle costs 2 yuan, two bottles cost 4, three bottles cost 6. The number changes; the way we work out the price does not. A rule like this — put in a number, follow a fixed rule, and get one result for each input — is called a function.
Many questions in science ask how one quantity depends on another. How far does a spring stretch when we pull it harder? How high is a thrown ball one second after it leaves the hand? Each time, we put in one number, follow a fixed rule, and get another number. Before we can draw such a relationship, or ask how quickly it changes, we need a clear way to talk about the rule itself. That is what a function is for, and you will meet it again on almost every page of this site, from the spring to the derivative.
Try a rule we can calculate by hand: multiply a number by 2, then add 1. An input of 0 gives 1; an input of 1 gives 1 × 2 + 1 = 3. The rule stays the same while our chosen number changes. A table keeps each input with its result, and a point on a graph gives that pair a position. We want to understand how these descriptions express the same rule, and what the graph can tell us. This page only uses multiplication and addition, and each letter is explained where it first appears.
Start with a rule and a table
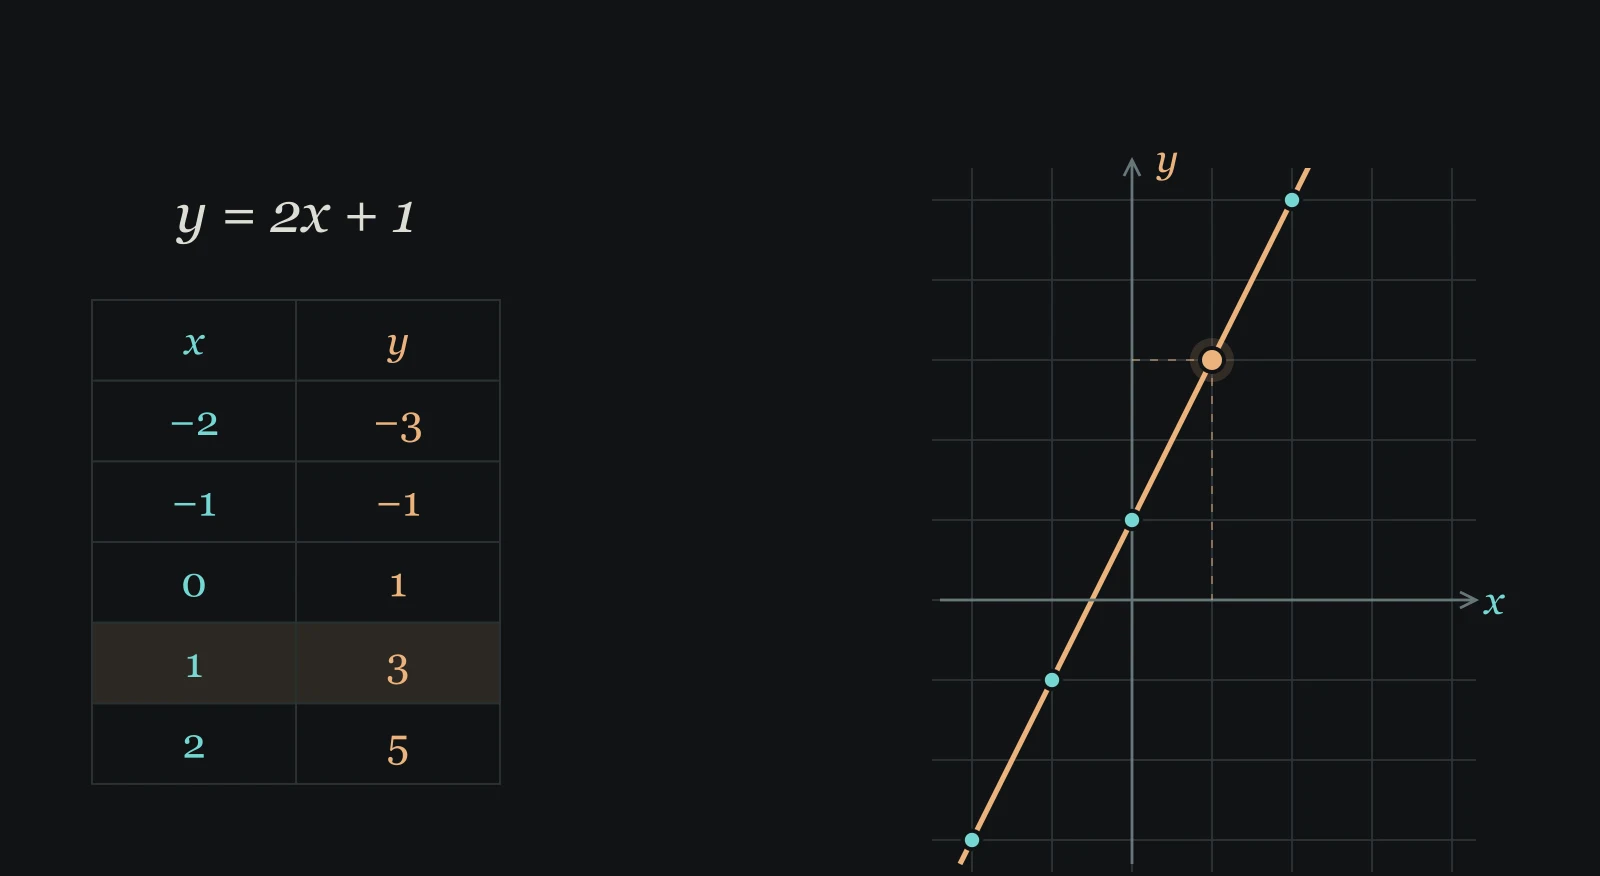
01 / 05Let the input be and the output be . means , and is a short way of writing “multiply by 2, then add 1”. In , choose a number for , multiply it by 2, then add 1 to get . Try the five inputs below. The table includes negative numbers because the rule also works to the left of zero; nobody buys minus one bottle of water, so the negative rows are only there to let us watch the rule take several steps. Each row records one input and its output.
Multiply by 2. Then add 1.
x is the number we put in. y is the result after following the rule. The table records both numbers together, one row for each input.
Put x=−2 into the rule: 2 × (−2) + 1 = −3. So the row records an input and its corresponding output.
Now plot one yourself
PRACTICEThis part is for you to do. It uses the coordinate work in 02 Coordinates and 03 Plot points; if you have not looked at those steps, take a look at those two tabs and come back — the practice will still be here. The rule is now y=3x-1: 3x means 3×x, and −1 means subtract 1 at the end. The 3 multiplying x is called the coefficient, and the −1 at the end is the constant. The coefficient sets how much y changes when x goes up by 1; the constant sets where the line starts. Work out y for each x in the table and fill it in; then place (x,y) on the grid, with x for left and right and y for up and down. If you place a point by mistake, click it again to remove it. The line appears only when all five points are right. If you get stuck, open Compare the calculation and check one row at a time. Five correct points do not explain why the whole line is straight; that comes below.
Place 5 more points. The points are joined once all five are correct.
Compare the calculation, one row at a time
Read each equality from left to right: multiply by the coefficient, then add the constant. The ordered pair keeps x first and the result second. After you check one row, close this explanation and place that row on the grid yourself.
(Advanced — skip it if you like.) Why is the whole graph a straight line? Call the number multiplying x the coefficient m, and the constant at the end c. Increase x by a small amount h, not zero: the new output is m(x+h)+c, and the old output is mx+c. Subtract the old from the new: the c and the mx cancel, leaving mh. So each increase of 1 in x raises y by m, the same amount every time; points that rise by equal steps lie on a straight line. This fixed change is called the slope. Checking five points alone would not prove this.
The five steps use one example throughout, , with any input ; the practice at the end uses new rules. Each table contains five examples, and the coordinate window displays only part of the complete line. Before you go, try one: when the input is 3, what is ? (.)